
Open any financial news site right now and you’ll find the same story on repeat: technology and AI stocks are overvalued, data center spending is out of control, and a crash is coming. It’s a compelling narrative. It’s also, at least for now, not what the charts are showing.
Let’s look at the actual evidence, using weekly charts of the S&P 500 ($SPX) and the Technology Select Sector SPDR (XLK).
The Bubble Narrative
The case for a bubble usually runs like this: AI and tech valuations have run too far, too fast; hundreds of billions of dollars are being poured into data center build-outs with uncertain near-term payoff; and history says parabolic moves like this one end badly. It’s a reasonable worry to hold, and it’s not without precedent.
But worry isn’t the same as evidence. If a serious correction were building underneath the surface, we’d expect to see it show up in volume and accumulation/distribution data before price actually breaks down. So far, that’s not what’s happening.
What the Chaikin Oscillator Shows
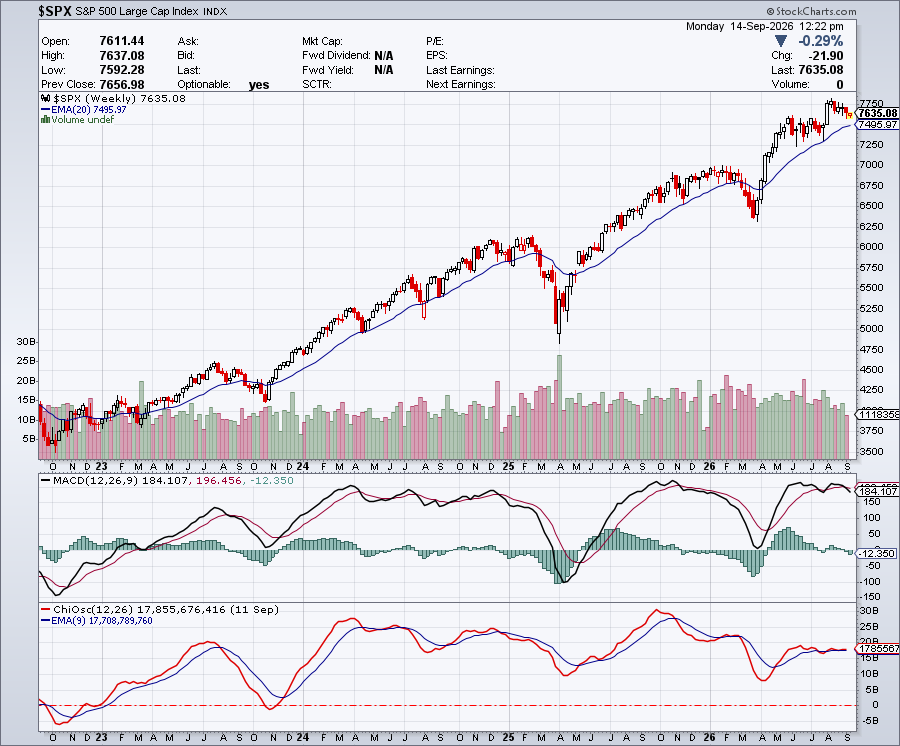
Charts by stockcharts.com
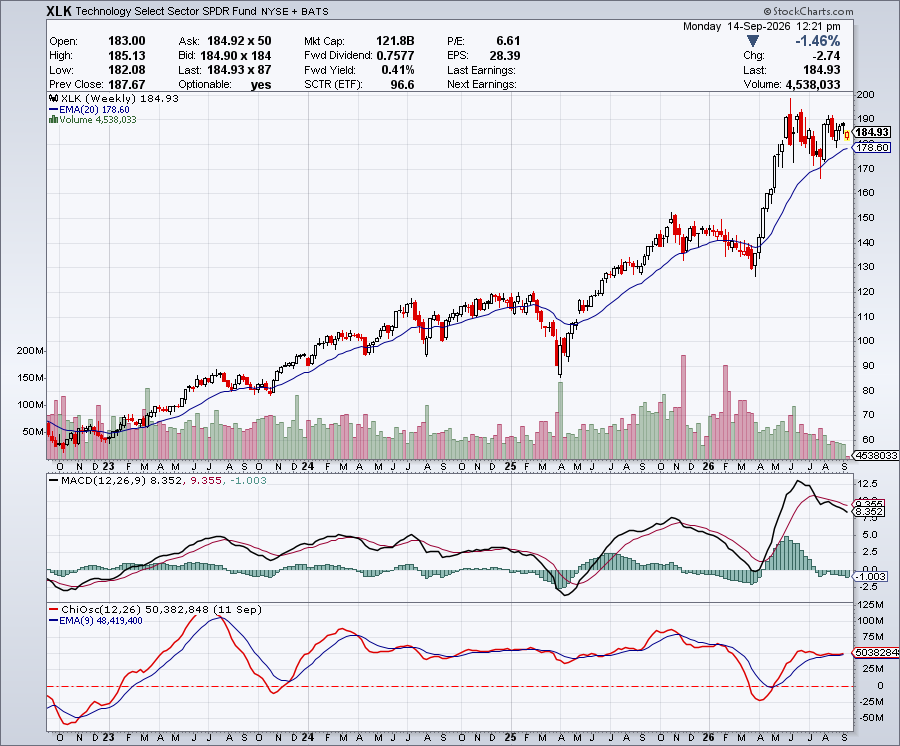
Both charts include the Chaikin Oscillator in the bottom panel — a tool that measures the momentum of buying and selling pressure by comparing short- and long-term moving averages of the Accumulation/Distribution Line. In plain terms: it tells you whether big money is quietly accumulating or distributing shares, often before that shows up clearly in price.
On both the S&P 500 and XLK, the Chaikin Oscillator has been running roughly parallel to the zero line since the high made at the beginning of June. It hasn’t collapsed below zero, and it isn’t rolling over sharply the way the MACD’s slope would suggest if real distribution were underway. That’s a meaningful detail. Sideways, above-zero readings on the Chaikin Oscillator typically reflect steady, ongoing accumulation — not the kind of selling pressure you’d expect to see building ahead of a major top.
Compare that to what happened around the April 2025 low on both charts: the oscillator dropped sharply below zero, well ahead of the eventual price recovery, and it also spiked hard during past distribution phases. That’s the signature of genuine stress in the market. We’re simply not seeing that signature right now.
What This Suggests
None of this means tech stocks are cheap, or that data center spending is sustainable at current levels forever, or that a pullback is off the table entirely. Markets can and do correct even during genuine accumulation phases, and elevated valuations remain elevated valuations regardless of what the oscillators say this week.
But “overvalued” and “about to crash” are two different claims, and the second one needs its own evidence. Right now, the accumulation data on both the broad market and the technology sector specifically doesn’t support the crash thesis. What it supports is a more boring outcome: a period of sideways consolidation, working off some of the recent gains and cooling technical readings, followed by another leg higher once that consolidation resolves.
That’s not a prediction carved in stone — markets change their mind constantly, and this view would need revisiting if the Chaikin Oscillator started rolling over below zero, or if price action itself started breaking down through key support. But as things stand today, the accumulation picture on both XLK and the S&P 500 looks far more consistent with “pause before the next move up” than it does with “bubble about to burst.”
This is a technical read of price and volume behavior, not a fundamental valuation call, and it isn’t investment advice. Always combine indicators like the Chaikin Oscillator with your own risk management and broader market context.