
Since its high on 21st August Bitcoin has pulled back and the MACD has dropped below zero. But the volume picture tells a very different story — and that is what matters.
What the price chart shows
Bitcoin peaked on 21st August at just above $80,000 and has since pulled back to the mid $70,000s — a decline of roughly 5 to 7 percent depending on the day. The MACD on the daily chart has dropped below its zero line, which on the surface looks like a bearish momentum signal. To a trader relying purely on price-based indicators, this looks like a potential top forming after the rally from the June lows.
But price tells you only half the story. And in this case the other half — volume — is telling a very different one.
What the indicators are actually showing
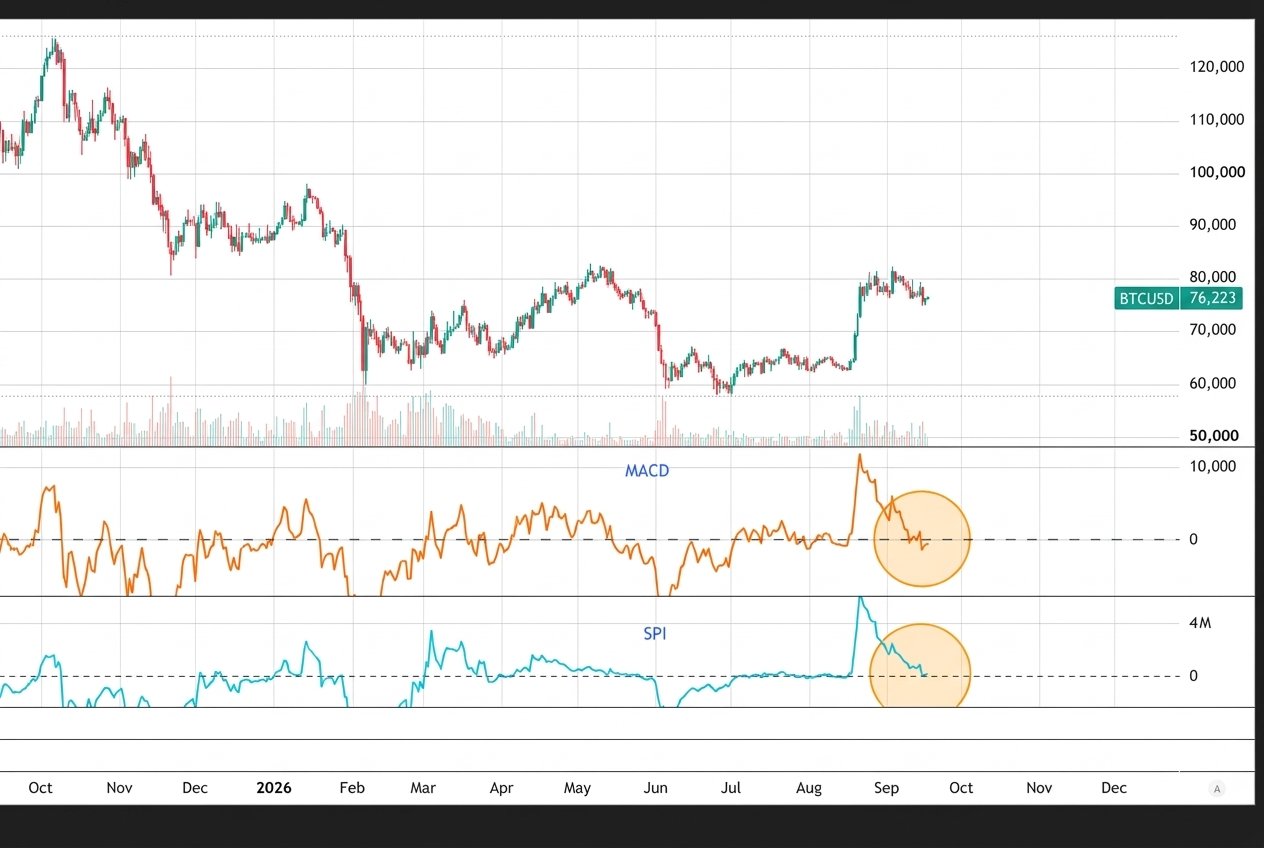
The daily chart shows two indicators: the MACD and the Supply/demand index (SPI). The key is in the relationship between these two indicators — and the circles on the chart highlight exactly where to look.
The MACD has dropped below its zero line — momentum has turned negative in the short term. But the SPI, which measures the volume behind price moves, is still above its own zero line. It has come down from its August peak but remains positive. That is a meaningful divergence. If Bitcoin were genuinely topping out and preparing for a significant decline, you would expect the opposite — the SPI would be falling sharply below zero as sellers drove price down with real conviction, while the MACD might still be clinging above zero on residual momentum.
Instead what you see is the MACD reflecting weakening short-term momentum while the SPI confirms that the selling volume behind the price decline has been modest. The people who bought Bitcoin on the way up from the June lows are sitting on significant profits — and they are not selling. That is what the SPI is recording.
“If the selling volume during a pullback is low, it tells you that holders are not panicking. They bought at lower prices, they are in profit, and they are holding. That is the opposite of a top — it is consolidation.”
Why the volume picture matters more than the MACD here
The MACD is a price-derived indicator. When price pulls back, the MACD follows it lower — that is what it is designed to do. It confirms the short-term price move but tells you nothing about whether that move is driven by genuine selling pressure or simply by the absence of new buyers at these levels temporarily.
The EFI answers precisely that question. It multiplies volume by the price change on each candle — so a large price move on low volume produces a small EFI reading, while a smaller price move on heavy volume produces a large one. The fact that the SPI has stayed above zero during this pullback, despite the MACD going negative, confirms that the selling behind the price decline has been light. There is no sustained, volume-backed selling pressure. Bitcoin is digesting its August rally, not reversing it.
The Stochastic at the bottom of the chart is also worth noting — at 20.20 it is deep in oversold territory on the daily timeframe. That alone is not a buy signal, but in combination with the volume picture it adds further weight to the case that the short-term move down is close to exhausting itself.
The bigger picture has not changed
Zoom out to the weekly chart and the supply and demand picture for Bitcoin remains firmly bullish. Months of accumulation between the June 2026 lows and the August breakout built a substantial cause. By Wyckoff’s law of cause and effect, that cause supports a significantly larger effect than a move to $80,000 and back. The weekly accumulation that preceded this move suggests Bitcoin has considerably further to go before the current cycle peaks.
The daily pullback is noise within that larger signal. When short-term momentum indicators go negative while volume remains supportive, the correct interpretation is consolidation — a pause while the market digests the previous move and prepares for the next one.
When the MACD drops below zero but selling volume stays positive, the market is resting — not reversing. The next leg up begins when buyers return to a market where the sellers never really showed up.
This analysis is for educational and informational purposes only and does not constitute financial advice or a recommendation to buy or sell any asset. Cryptocurrency markets are highly volatile and carry significant risk including the risk of total loss. Do your own research and never invest more than you can afford to lose.
More Bitcoin and crypto analysis on the blog
Supply and demand analysis applied to crypto and stocks — published two to three times a week.Read more