
Every trader who’s used MACD long enough has a scar to show for it. It’s one of the most popular momentum indicators out there, and for good reason — it’s simple, it’s visual, and it often catches the big turns. But MACD has a major drawback: it tells you when momentum is shifting, not whether there’s any real buying or selling behind that shift. And that gap is exactly where traders get hurt.
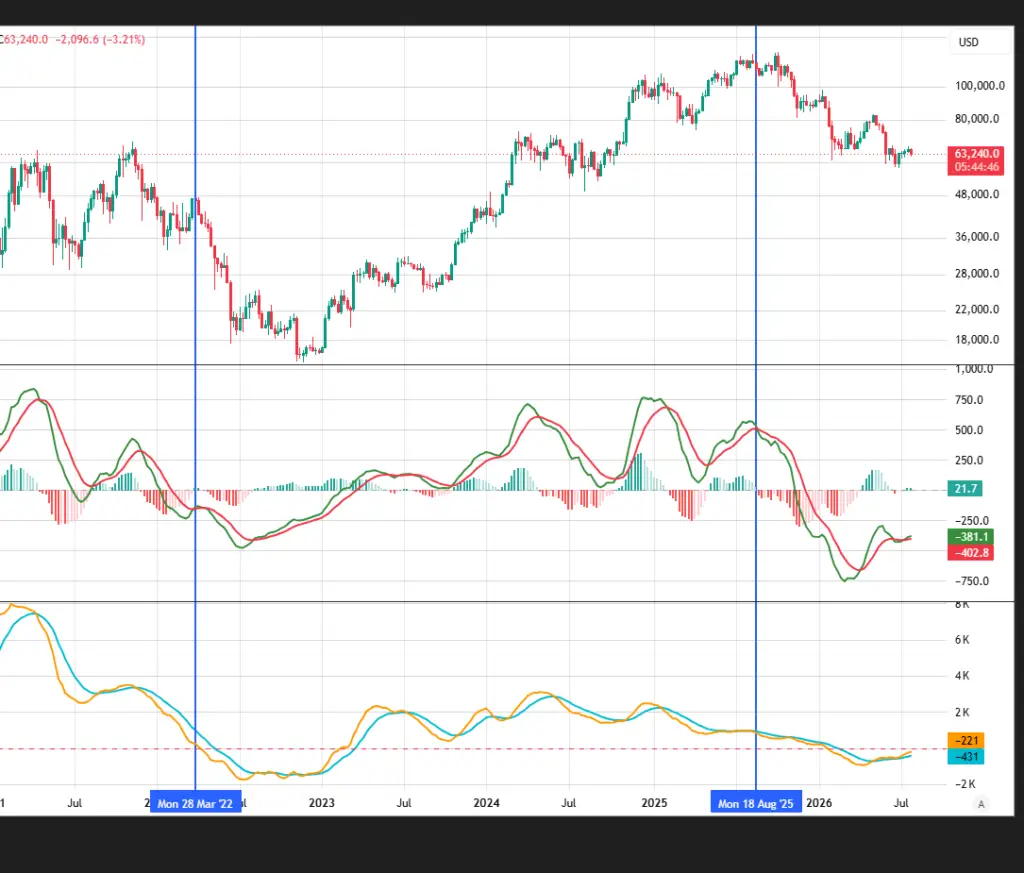
Chart: BTC weekly, MACD (middle panel) vs supply/demand indicator (bottom panel)]
28 March 2022 — the trap
Look at the blue line on 28 March 2022. If you were watching MACD alone here, you’d have seen the kind of setup that often precedes a bounce. Plenty of traders bought into it. What followed instead was one of the ugliest legs of the 2022 bear market — BTC ground steadily lower for months.
The reason the MACD signal failed is sitting right there in the bottom panel. My supply/demand indicator was well below its signal line and going down. There simply wasn’t real demand entering the market to support a reversal. MACD was reading momentum off a market that had no conviction behind it in either direction. When there’s no demand, a momentum cross is just noise — it has nothing to push against.
18 August 2025 — the signal you had to respect
Compare that to the bearish MACD cross on 18 August 2025. On its own, another MACD cross might have been easy to dismiss — BTC had just spent April through August grinding higher, and dismissing bearish crosses during an uptrend is a common (and often correct) habit. But the supply/demand indicator told a different story. Through that entire April–August rally, it showed supply quietly building — or at best, very little genuine demand pushing the price up. The rally was thin. When MACD rolled over here, it was confirming what the supply/demand line had already been warning about. That cross needed to be taken seriously, and it was — BTC has fallen roughly 50% since the October 2025 top.
Where that leaves us now
Here’s the part I find most interesting. Despite that ~50% drawdown since October, my supply/demand indicator has barely dipped below its own zero line — nowhere near the depth it reached during genuine distribution phases like the one before the 2022 crash. In other words, this decline has been much bigger in price terms than it has been in actual supply. Heavy price falls without heavy supply behind them tend to run out of steam.
Just as importantly, that supply/demand line is now curling back up toward zero from below. That’s usually the signature of distribution finishing, not accelerating.
The takeaway
MACD tells you when momentum has shifted. It doesn’t tell you whether real supply or demand is driving that shift — and that’s the difference between a signal worth acting on and one that’s about to trap you. Right now, price says we’ve fallen hard. My supply/demand indicator says the selling pressure behind that fall is thin and fading. That combination is what makes me believe BTC is at, or very close to, the bottom of this cycle.
Not financial advice — always do your own research.