The Foundation: How Markets Actually Move
Everything in this methodology is built on the work of Richard Wyckoff and his Three Laws:
- Supply and Demand – Price rises when demand exceeds supply, and falls when supply exceeds demand
- Cause and Effect – Periods of accumulation or distribution create future price moves
- Effort vs Result – Volume (effort) must align with price movement (result), or something is changing beneath the surface
These are not opinions. They are observable behaviours that repeat across all markets.
Crypto, stocks, forex—it doesn’t matter.
5-minute chart or daily chart—it doesn’t matter.
The structure is always the same.
The Problem With Traditional Chart Reading
The traditional way to apply these laws is through direct chart analysis:
- Watching individual candles
- Interpreting volume spikes
- Trying to identify accumulation and distribution zones
- Making judgement calls in real time
This works—but it has three major problems:
- Subjective – Two traders can read the same chart differently
- Slow – Requires constant attention and experience
- Inconsistent – Difficult to apply across multiple markets and timeframes
For most people, this leads to hesitation, second-guessing, and missed opportunities.
My Approach: Turning Laws Into Signals
Instead of reading charts manually, I focus on something much more practical:
Building signals that reflect the underlying laws of the market
Not random indicators.
Not overfitted strategies.
But tools designed specifically to answer questions like:
- Is demand currently overwhelming supply?
- Is accumulation taking place beneath the surface?
- Is effort increasing without corresponding price movement?
What Most Traders See vs What Actually Matters
PRICE CHART (What most people focus on)
Most traders focus only on the top layer (price).
My approach focuses on what’s driving it underneath.
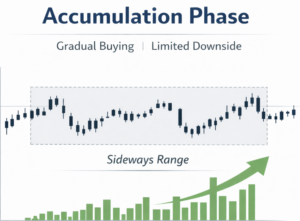
During accumulation, the behaviour of volume begins to shift.
Pullbacks tend to occur on lower volume, while upward movements are supported by higher and often increasing volume. This suggests that selling pressure is weakening, while demand is gradually strengthening.
In practical terms, fewer participants are willing to sell as price declines, while more are prepared to buy as price begins to rise within the range. The market is starting to recognise value at these levels.
A similar process occurs in reverse during distribution.
Rallies become weaker and are often accompanied by lower volume, while downward movements begin to show increased activity. This indicates that buying interest is fading, and supply is becoming more dominant.
As this develops, the balance shifts. What was previously seen as value is now seen as opportunity to sell, and the market begins to transition away from the prior upward move.
The Key Principle: Price Is a Result, Not a Cause
Price does not move on its own.
It is the result of:
- Positioning
- Accumulation
- Distribution
- Imbalances between buyers and sellers
This leads to an important idea:
By the time price clearly moves, the underlying process has already begun
Diagram: How Moves Actually Develop
PHASE 1: ACCUMULATION
Price: → → → (sideways)
Volume: ↑ ↑ ↑ (quiet increase)
Smart money building positions
PHASE 2: IMBALANCE
Demand > Supply
Early upward pressure begins
PHASE 3: PRICE MOVE
Price: ↑↑↑↑↑ (visible trend)
Public participation increases
Most traders enter in Phase 3
The goal is to identify Phase 1 → Phase 2 transition
Why Indicators Still Matter (If Used Correctly)
There’s a common belief that indicators are “lagging” and therefore useless.
That’s only true when they are:
- Used in isolation
- Poorly designed
- Not aligned with market structure
When indicators are built to reflect Wyckoff’s laws, they become:
- Measurement tools, not predictions
- Filters, not signals on their own
- Context providers, not decision-makers
My Philosophy on Indicators
I don’t ask:
“Does this indicator give good signals?”
I ask:
“Does this indicator accurately reflect supply, demand, and effort?”
That’s a completely different approach.
The Idea of Anticipation
A key belief behind this methodology is:
Price can often be anticipated—not perfectly, but consistently
Why?
Because:
- Accumulation happens before price rises
- Distribution happens before price falls
- Volume often shifts before price fully reacts
Diagram: Effort vs Result (Early Warning Signal)
SCENARIO: Increasing effort, weak result
Volume: ▂▃▅▇▇▇▇
Price: ↑ ↑ →
Interpretation:
Effort is increasing, but price is not responding strongly
→ Possible exhaustion or hidden distribution
This is where many of the best opportunities come from.
Signals vs Noise
The purpose of this methodology is not to generate constant signals.
It is to:
- Filter out low-quality conditions
- Highlight moments where the laws align
- Act only when the odds shift
Why This Works Across All Markets and Timeframes
This approach is not tied to:
- A specific coin
- A specific timeframe
- A specific indicator
It works because:
Human behaviour does not change—only the scale does
- Fear and greed operate the same way everywhere
- Accumulation and distribution exist in all liquid markets
- Supply and demand always determine price
What You’ll See in My Signals
Every signal I share is based on a combination of:
- Volume behaviour (effort)
- Price response (result)
- Signs of accumulation or distribution
- Imbalance between buyers and sellers
Not guesses.
Not hype.
Not random entries.
Final Thought
Most traders spend years trying to predict price directly.
This approach does something different:
It focuses on the forces that move price—and lets price follow